
How to Read a Coffee Roast Curve:
Rate of Rise, Bean Temperature, and Development Time Explained
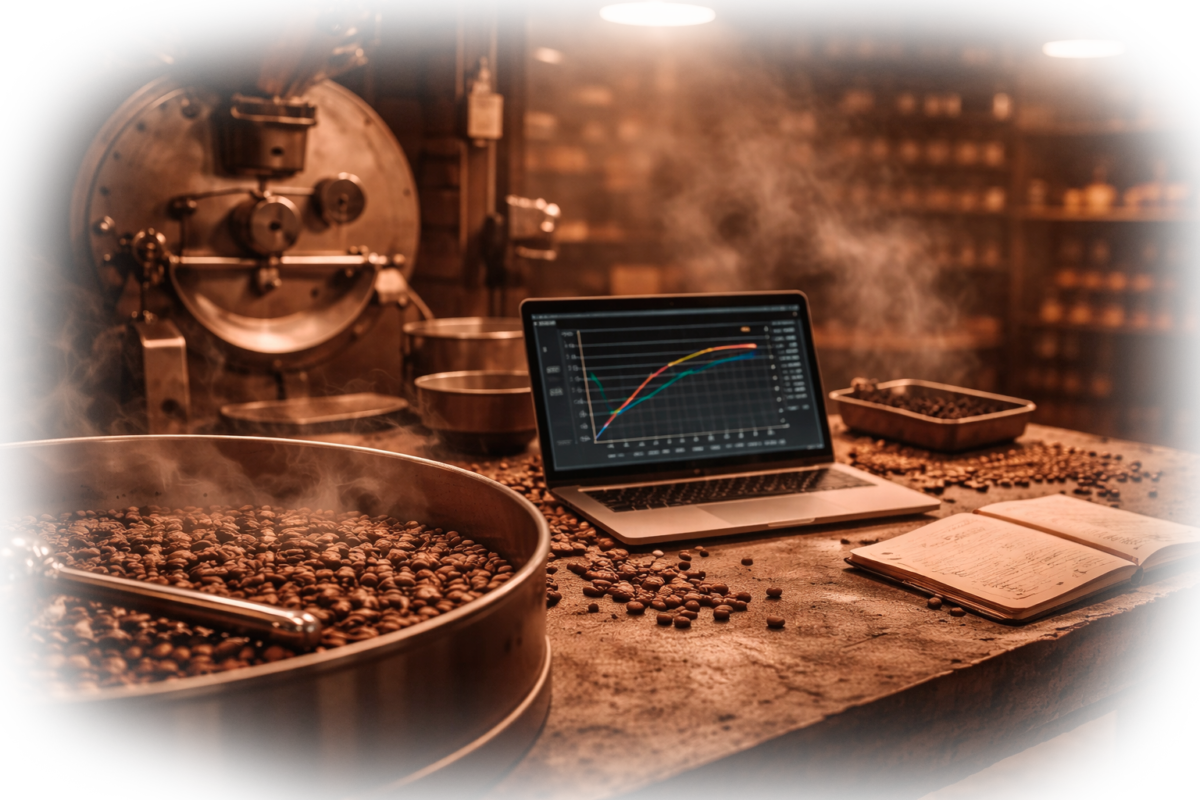
A Roast Curve Is Just the Coffee Telling You What Happened
Roasting software makes curves look technical.
Lines moving across screens. Numbers updating every second.
It can feel complicated at first.
But the truth is simpler.
A roast curve is just a record of how heat moved through the coffee.
Nothing more.
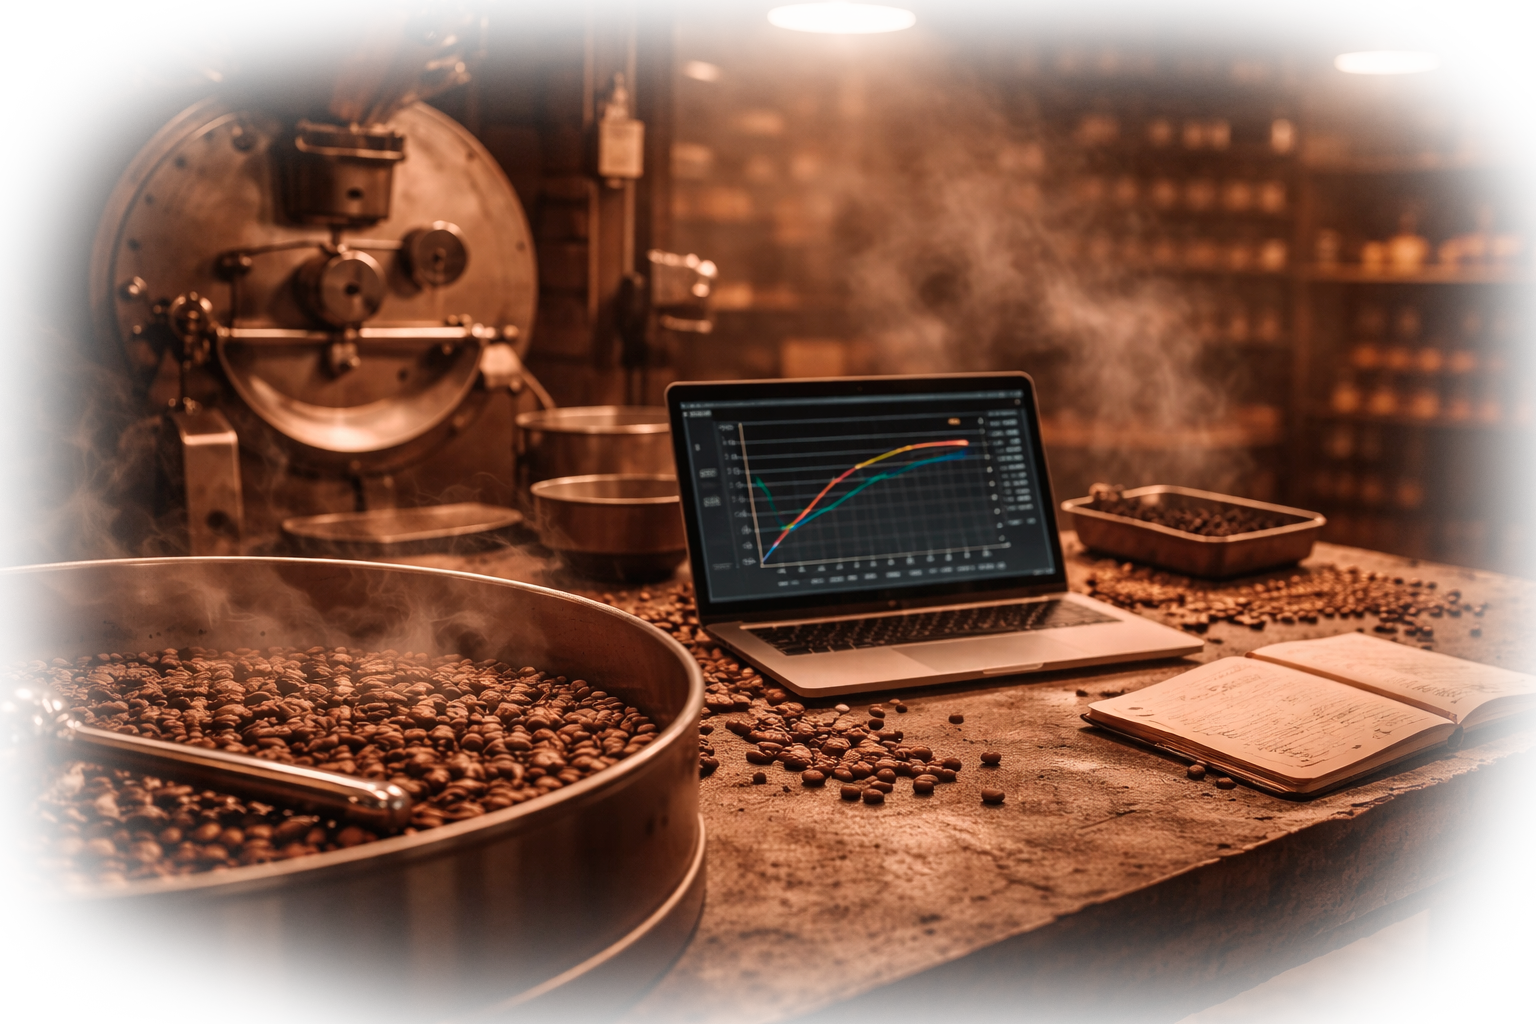
Roasting software makes curves look technical.
Lines moving across screens. Numbers updating every second.
It can feel complicated at first.
But the truth is simpler.
A roast curve is justa record of how heat moved through the coffee.
Nothing more.
And once you learn to read three things, the whole picture starts making sense:
-
Bean temperature
-
Rate of rise
-
Development time
Those three quietly explain most of what happened in the drum.
Let’s break them down.
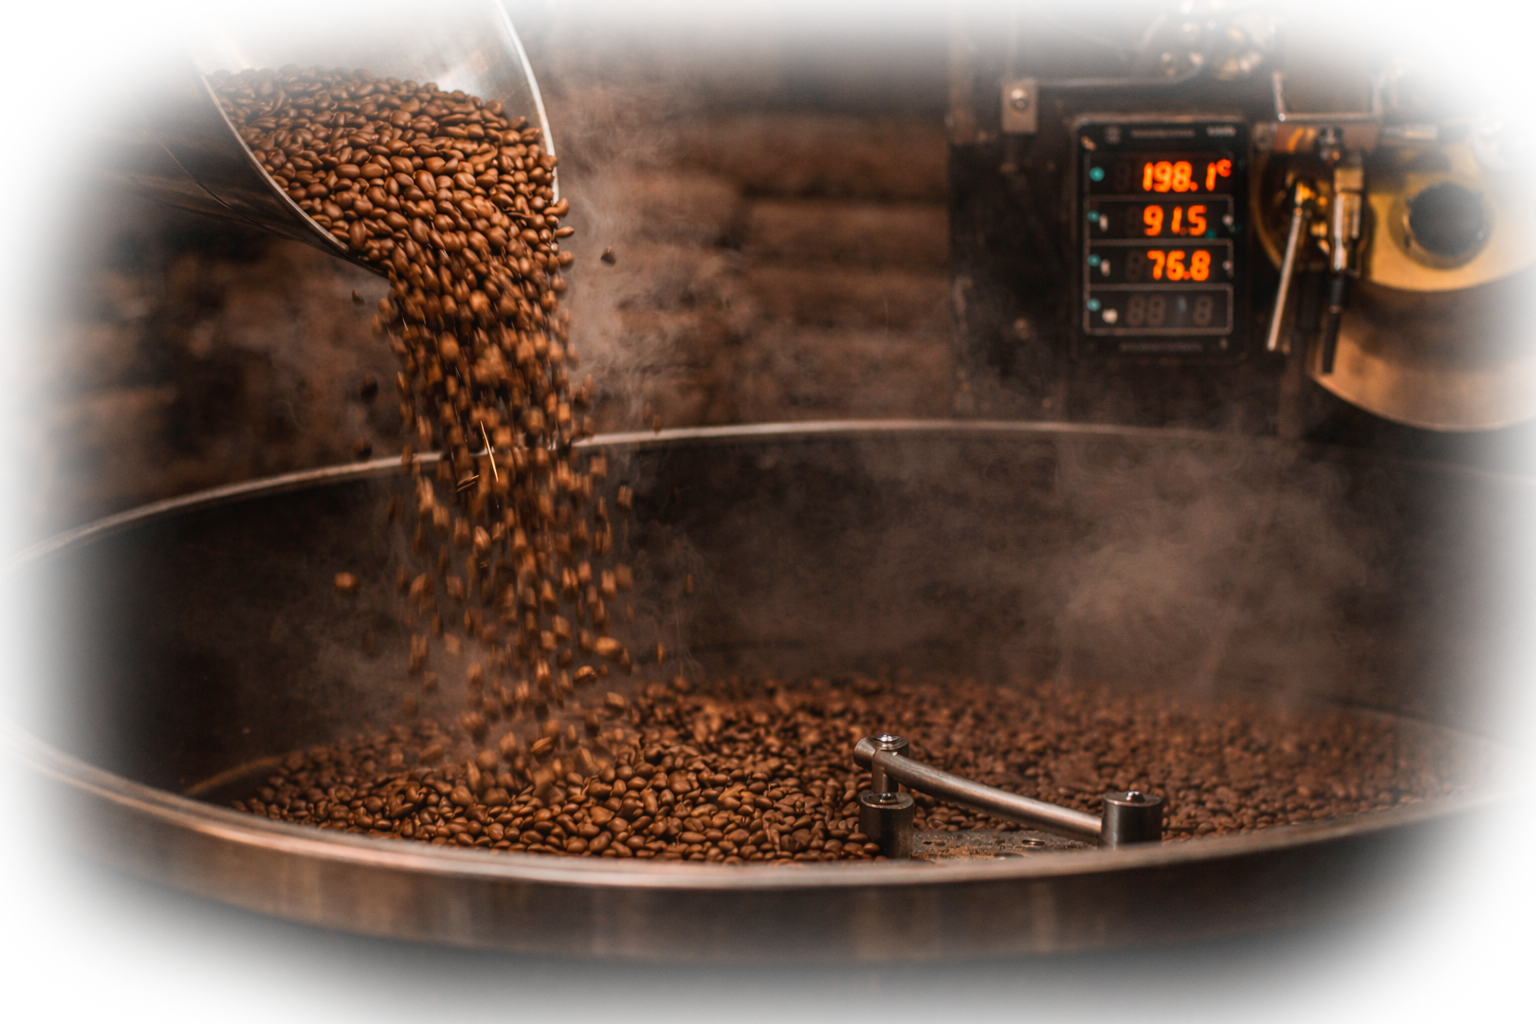
First: Bean Temperature
Bean temperature is the backbone of the roast curve.
It tracks how hot the coffee beans themselves are becoming during roasting.
Not the air.
Not the drum.
The beans.
Most roasters place a probe inside the drum that touches or sits near the beans.
The software then plots that temperature over time.
Typical Density Signals
When you look at a roast curve, the bean temperature line tells you the general story:
| STAGE | WHAT'S HAPPENING |
| Charging | Coffee enters the hot drum |
| Turning point | Temperature dips before rising again |
| Drying phase | Moisture leaving the beans |
| First crack | Internal pressure breaks the structure |
| Development | Flavor compounds forming |
You don’t need to obsess over every degree.
Just understand the rhythm.
Coffee warms up.
Builds pressure.
Cracks.
Then develops flavor.
Second: Rate of Rise (RoR)
Rate of Rise is where many new roasters get confused.
But it’s actually simple.
RoR measures how fast the bean temperature is increasing.
Think of it as the speed of the roast.
If bean temperature is the road…
RoR is how hard you’re pressing the gas pedal.
Why Rate of Rise Matters
RoR helps you see if the roast is:
-
accelerating too fast
-
stalling
-
developing smoothly
A healthy roast curve usually shows a gradually declining RoR.
In other words:
The roast slows down gently as it progresses.
Not abruptly.
Not chaotically.
Just steady.
Common Screen Size Categories
| SCREEN SIZE | GENERAL DESCRIPTION |
| Sudden spike | Too much heat added |
| Crash | Roast lost momentum |
| Flick | RoR jumps near the end |
| Smooth decline | Generally stable roast |
These patterns often explain problems you taste later in the cup.
Third: Development Time
Development time begins right after first crack.
This is when the coffee shifts from structural changes to flavor formation.
Sugars caramelize.
Aromatics develop.
Acidity settles into balance.
Most roasters measure development in time and percentage.
Example:
| ROAST STAGE | EXAMPLE TIMING |
| Total roast time | 10:00 |
| First crack | 8:30 |
| Development | 1:30 |
| Development % | 15 % |
Different styles use different development ranges.
But the key idea stays the same.
Too short, and the coffee can taste sharp or underdeveloped.
Too long, and it starts tasting flat or baked.
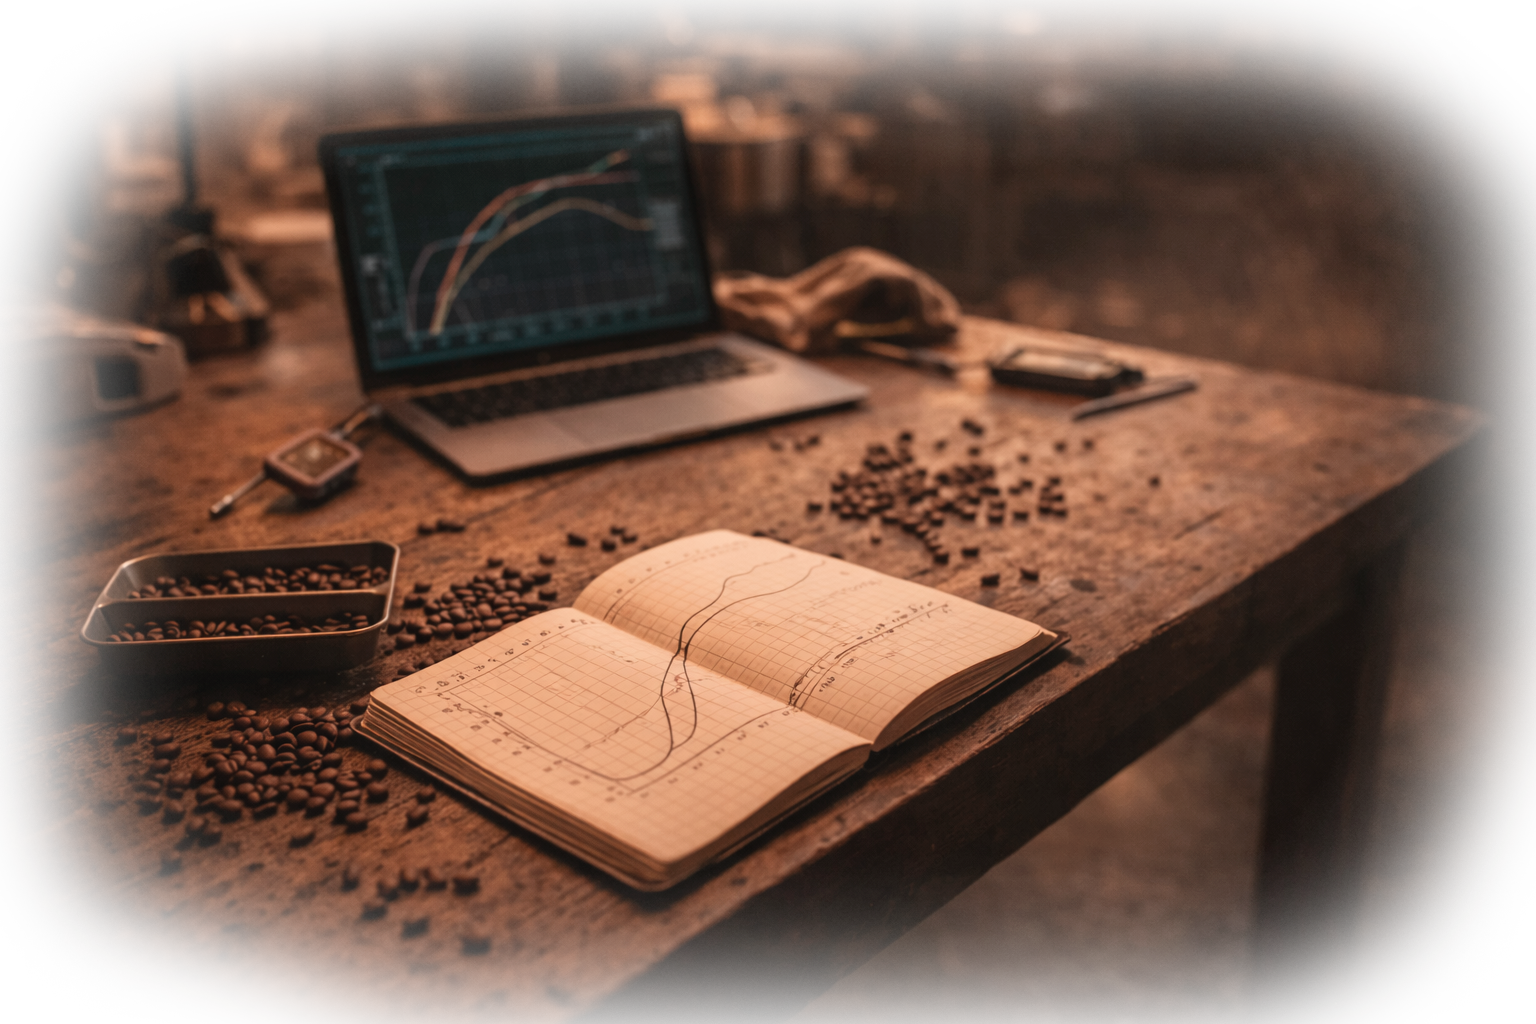
Seeing the Whole Roast Curve
Each metric tells a piece of the story.
But the real insight comes when you read them together.
A balanced roast curve often shows:
• steady bean temperature rise
• gradually declining RoR
• controlled development after first crack
Nothing dramatic.
Just controlled energy.
That’s what consistency looks like.
If you’re dialing in Colombian coffees and want beans that behave predictably in the roaster, that’s something we pay attention to from the start.
Good structure makes roasting easier.
And easier roasting usually means better coffee.
A Small Truth About Roast Curves
It’s easy to get hypnotized by graphs.
Some roasters spend hours chasing the perfect shape.
But curves are tools.
Not trophies.
At the end of the day, the only curve that matters is the one you taste in the cup.
The graph just helps you get there again tomorrow.
FAQ –Schema Ready
If you're roasting Colombian coffee and want green lots that behave cleanly through the curve, that's the kind of coffee we move.
No drama in the drum.
Just beans that roast the way they're supposed to.
When you're ready, we’ll send samples. Quietly.